Treasury Bond Yield Curve
FT reports “US 10-year Treasury yield reaches 3% for first time since 2018” in 2nd May 2022. But, what do they mean by US 10-year Treasury? Nowhere in the article, they defined what it was and mostly likely it was the yield rate of the most recently-issued (also known as on-the-run) 10-year note (see here for various debt types inclduing note), or possibly the yield implied from the futures contract on 10-year tenor (see here). But, what about 30-year bond issued 20 years ago (referred to as vintage) with 10-year time-to-maturity left? How is it related to the headline 10-year yield?
All Bonds
Most market data sites such as yahoo show the yields at only a few benchmark tenors such as 2-, 5-, 10- and 30-years. But, there are many more bonds out there. Limiting ourselfs to only conventional bonds (fixed-coupon bonds of type ‘note’ and ‘bond’), the figure below shows a scatter plot of time-to-maturity and yield pairs across all relevant ISINs as of 15th June 2022 (a historic date when the Federal Reserve increase the fund rate by 75bp).
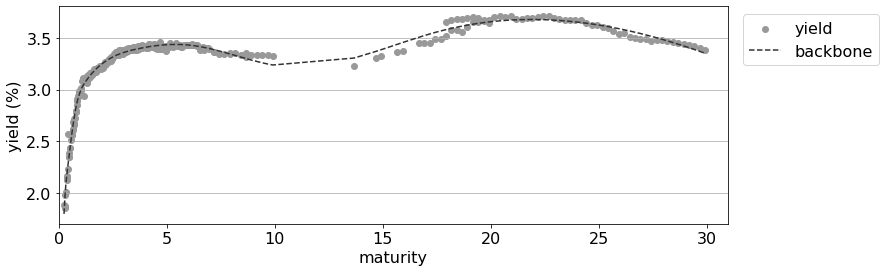
- price data sourced from TreasuryDirect
- yields (dots) are calculated using Python QuantLib Bond library.
- The backbone curve (dashed line) is a spline fit.
While the yield data provides a reasonably smooth term-structure, there are some notable deviations from the backbone curve, e.g. near 20y tenor. Here, we look at these basis quantities (differences between the ISIN-specific yield rates and the backbone rates) to learn underlying structures.
On-the-run and Vintage
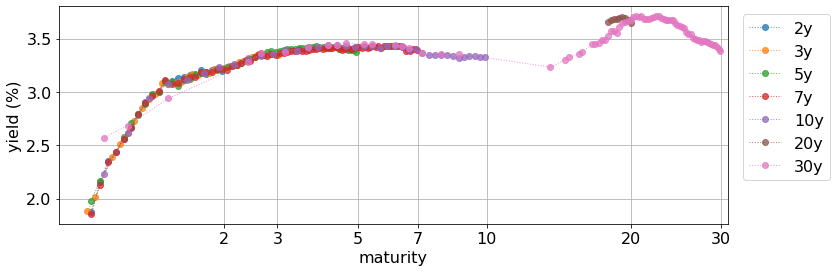
First, we assign a colour to each bond based on its original issue length in the figure below. Note that we applied a shift-log transform to the maturity axis to roughly even out across issue lengths (2,3,5,7,10,20,30). We see immediately the deviation near 20y is the basis between newly issued 20y bonds and 10y-old (vantage) 30y bonds.
Next, we remove the backbone rates and display the basis quantities in the figure below.
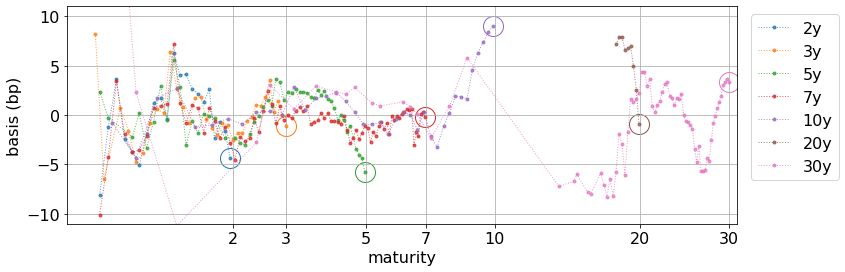
For each branch, we enclose the most-recently issued bond, known as the on-the-run (otr) bond, using a circle. At least in our data set, an otr bond seems to have either a larger or smaller basis than older bonds. For example, the 10y otr has the largest basis, indicating it is relatively cheaper than other 10y bonds. The opposite observation is for the 5y otr.
Effect of Coupon Size
From a pure economical perspective, the coupon size differences should explain the basis rate differences. To see whether this would be the case, we assign colours based on coupon sizes in the figure below.
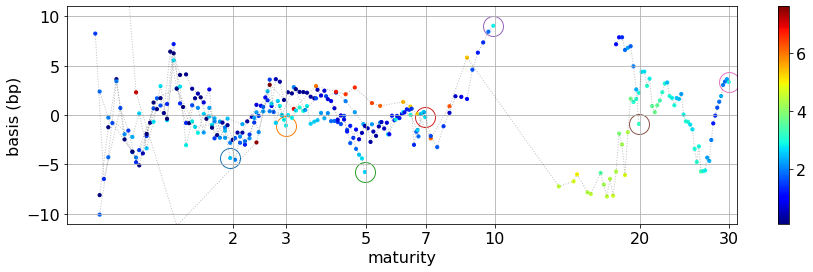
Let’s focus on those bonds near 5y maturity. While their coupon sizes vary between 0% and 6%, the bond with the smallest basis rate is the 5y otr whose coupon size is half-way through (the exact value is 2.625%). Thus, there are other factors (market demands on a specific bond, liquidity, etc) influencing the ultimate bond yields.