Debug Jupyter Python Notebook via VS Code
VS Code finally supports debugging for its own Jupyter Notebook. See ‘October 2021 Release’, and it works like a charm.
The following is relevant with the standard version of Jupyter Notebook (e.g. via web browsers).
Background
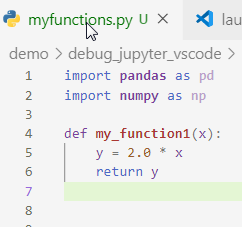
When writing a notebook using Jupyter (Notebook or Lab), it is common to write actual codes as separate modules (.py) and call them from the notebook. This post is how to use VS Code debugger from Jupyter to debug (i) cells within Jupyter and (ii) codes in .py files. Surprisingly, I couldn’t find any memos explaining this elsewhere.
Preparation
- Install
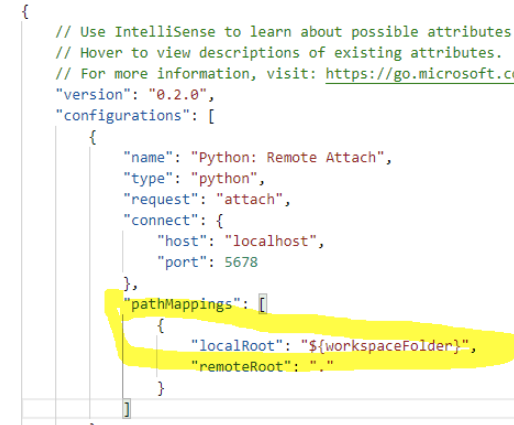
debugpy - Add a new config in VS Code
- click the bug/triangle button on the left.
-
click the gear button. This will open
launch.json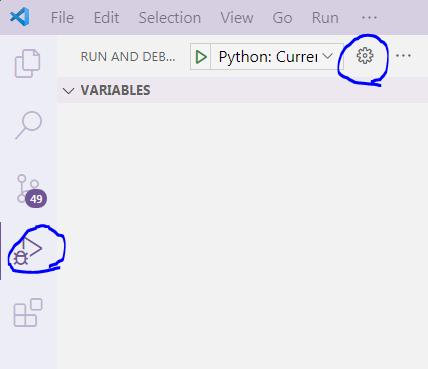
- click
Add Configuration->Python->Remote Attach -
simply accept the defaults (host = localhost, port = 5678) by pressing enters twice.
- This will create an additional config
Action
- Here is an example:
| VS Code | Jupyter |
|---|---|
 |
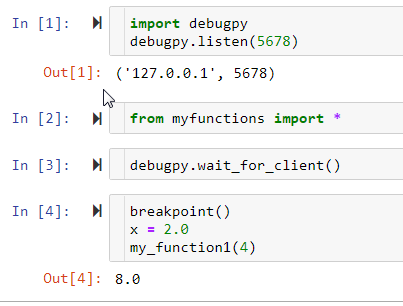 |
- From Jupyter: Execute step 3.
- Go back to VS Code and Select
Python: Remote Attachand click the green triange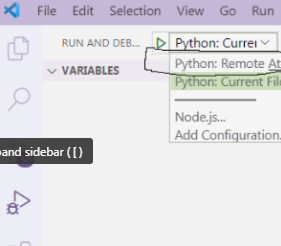
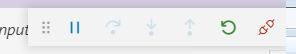
- Then, you will be connected and should be able to see the following:
- From Jupyter, exceute step 4. The
breakpoint()command invokes a debug activity. - Then, go back to VS Code. The cell is copied into a temperary file in VS Code. You can debug the codes in the usual way.
not found?
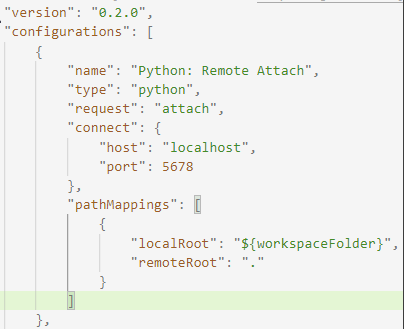
If the debugger does not find the relevant file, it is most likely that the path mapping needs to be specified.